

Our Data Studio templates



What is Google Data Studio?
Google Data Studio (formerly Google Looker Studio) was moved under the Looker product line at the end of 2022. In April 2026, it was officially announced that it would be renamed Google Data Studio again. As a free data visualization tool, it helps users present website, advertising and user data graphically.
Data Studio offers a range of options for presenting data. Besides line, pie and bar charts as well as simple tables and pivot tables, Data Studio also offers more specialized formats such as geo maps, scatter charts, stacked charts, treemaps and more. Beyond pure visualization, the dynamic filter and date range controls offer an advantage over static reports, for example from Excel. When a filter is set in the dashboard, the charts adjust dynamically.

Numerous ways to visualize your own data.
Every channel is about making the actions taken visible with data, whether SEO data such as clicks, impressions and queries from organic search, or advertising data from Google Ads or Meta Ads (formerly Facebook Ads). To present data from different channels efficiently and simply, it needs to be consolidated and visualized so it is easy to interpret. This is exactly where Google Data Studio comes in.


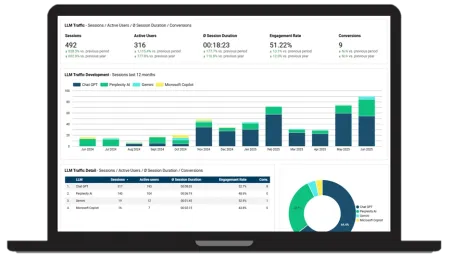
Simple dashboard with KPIs.
To display anything in the many charts, Data Studio needs the raw data. Data sources are connected to the dashboard via connectors.
Connecting Google products to the dashboard is relatively easy.
Google Ads and Google Analytics, for example, as well as other products such as Google Sheets, Google Search Console, YouTube and Google BigQuery are supported without any problems. The only requirement is that the account adding the data source to the dashboard has the corresponding access to the data source accounts. In addition to Google products, Google Data Studio also offers native integrations for CSV files, MySQL and PostgreSQL.


Is Data Studio worth it?
Google Data Studio offers many possibilities and helps users automate and simplify reporting and make data accessible to all stakeholders. Thanks to the many ways of connecting sources to the dashboard, reports are consolidated and do not have to be viewed separately. Still, keep in mind that it is only a data visualization tool that displays data and has limited calculation capabilities. If you want to combine different sources and run your own comparisons and calculations, Data Studio reaches its limits. In that case, you would need a data warehouse to prepare the data, which can then be visualized again in Data Studio. Since there are many ways to use the charts and data sources, Data Studio is also suited for more specialized analyses or workarounds beyond standard reports on ad or website data. For inspiration, take a look at the dashboards in our Data Studio hub or write to us if you need help!


If you have any questions or need support with Google Data Studio, Google Analytics or search engine marketing, contact us at info@claneo.com or via the contact form.

Partner integrations
In addition to the connectors offered by Google, there are numerous third-party partner integrations. With these, you can integrate other marketing channels outside the Google universe into Data Studio, for example. One of the largest providers of partner connectors is Supermetrics.

You can also program your own connectors if you have the necessary skills. Connectors are written in Google Apps Script, which is based on JavaScript. Data freshness varies by data source, meaning connectors retrieve data at different intervals. Google Sheets, for example, can be refreshed automatically every 15 minutes, Google Ads and Google Search Console every 12 hours and Google Analytics every 60 minutes.
However, you can always refresh the data manually with a button to update the charts and tables. As a rule, real-time data should not be viewed in Data Studio. Since several people usually work with a report and/or need to report to someone, Data Studio offers features for this too. By assigning user roles, other Google users can be added to the report with view or edit permissions. In theory, several users can work on a dashboard in real time. You can also export the entire report or individual pages as a PDF and have them emailed to you automatically at set intervals.


